Friday, October 26, 2018

The True Cost Of NOT Owning Your Home


The True Cost of NOT Owning Your Home
Owning a home has great financial benefits, yet many continue to rent! Today, let’s look at the financial reasons why owning a home of your own has been a part of the American Dream for the entirety of America’s existence.
Realtor.com reported that:
“Buying remains the more attractive option in the long term – that remains the American dream, and it’s true in many markets where renting has become really the shortsighted option…as people get more savings in their pockets, buying becomes the better option.”

What proof exists that owning is financially better than renting?

1. In a previous blog, we highlighted the top 5 financial benefits of homeownership:
  • Homeownership is a form of forced savings.
  • Homeownership provides tax savings.
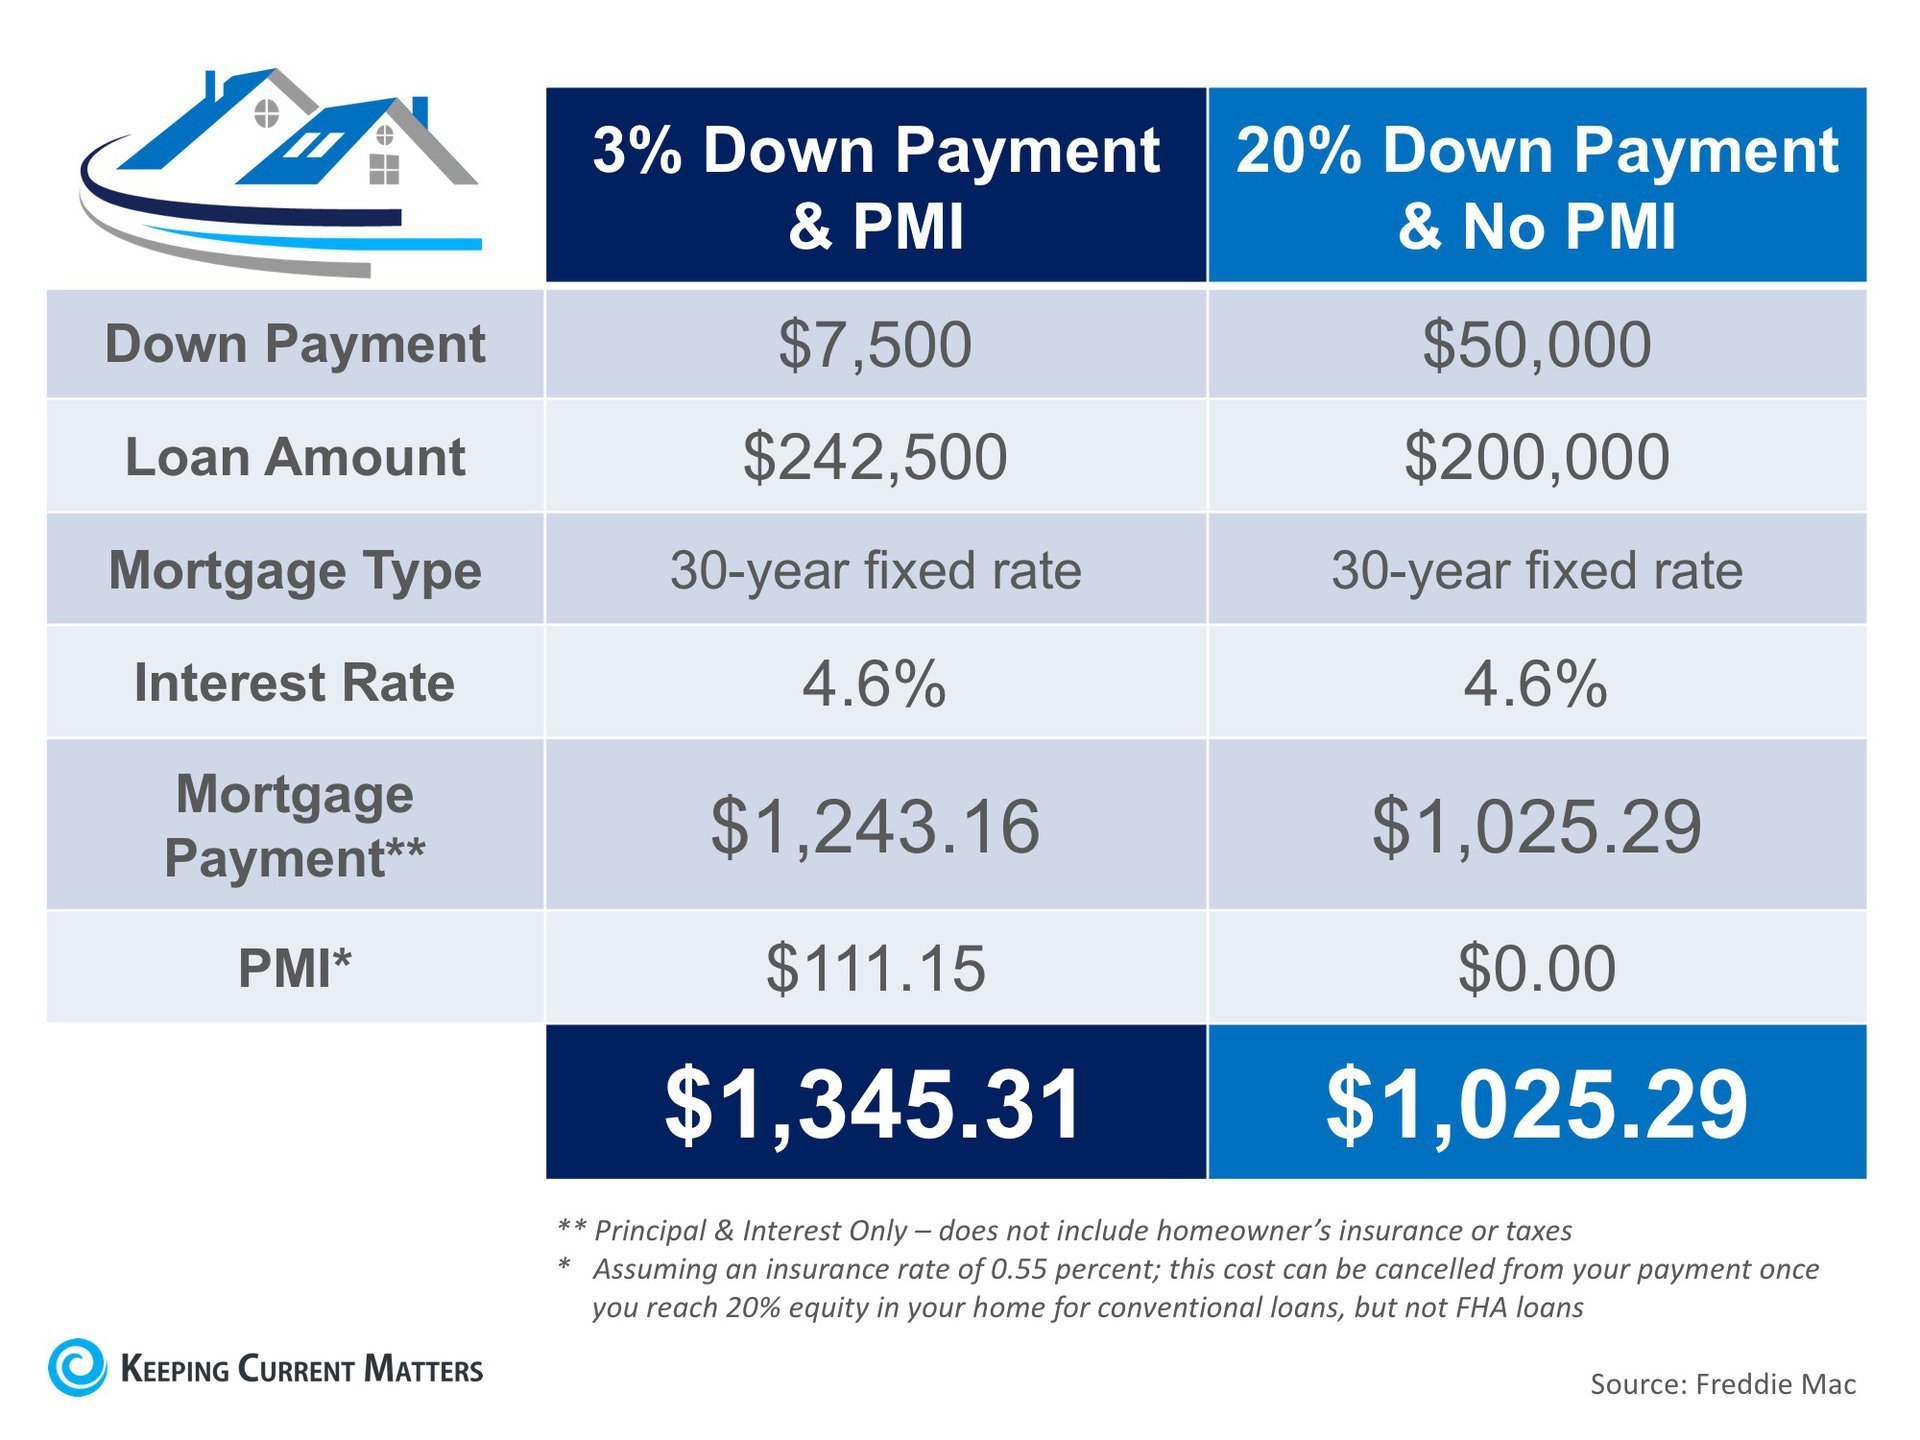
  • Homeownership allows you to lock in your monthly housing cost.
  • Buying a home is cheaper than renting.
  • No other investment lets you live inside of it.
2. Studies have shown that a homeowner’s net worth is 44x greater than that of a renter.
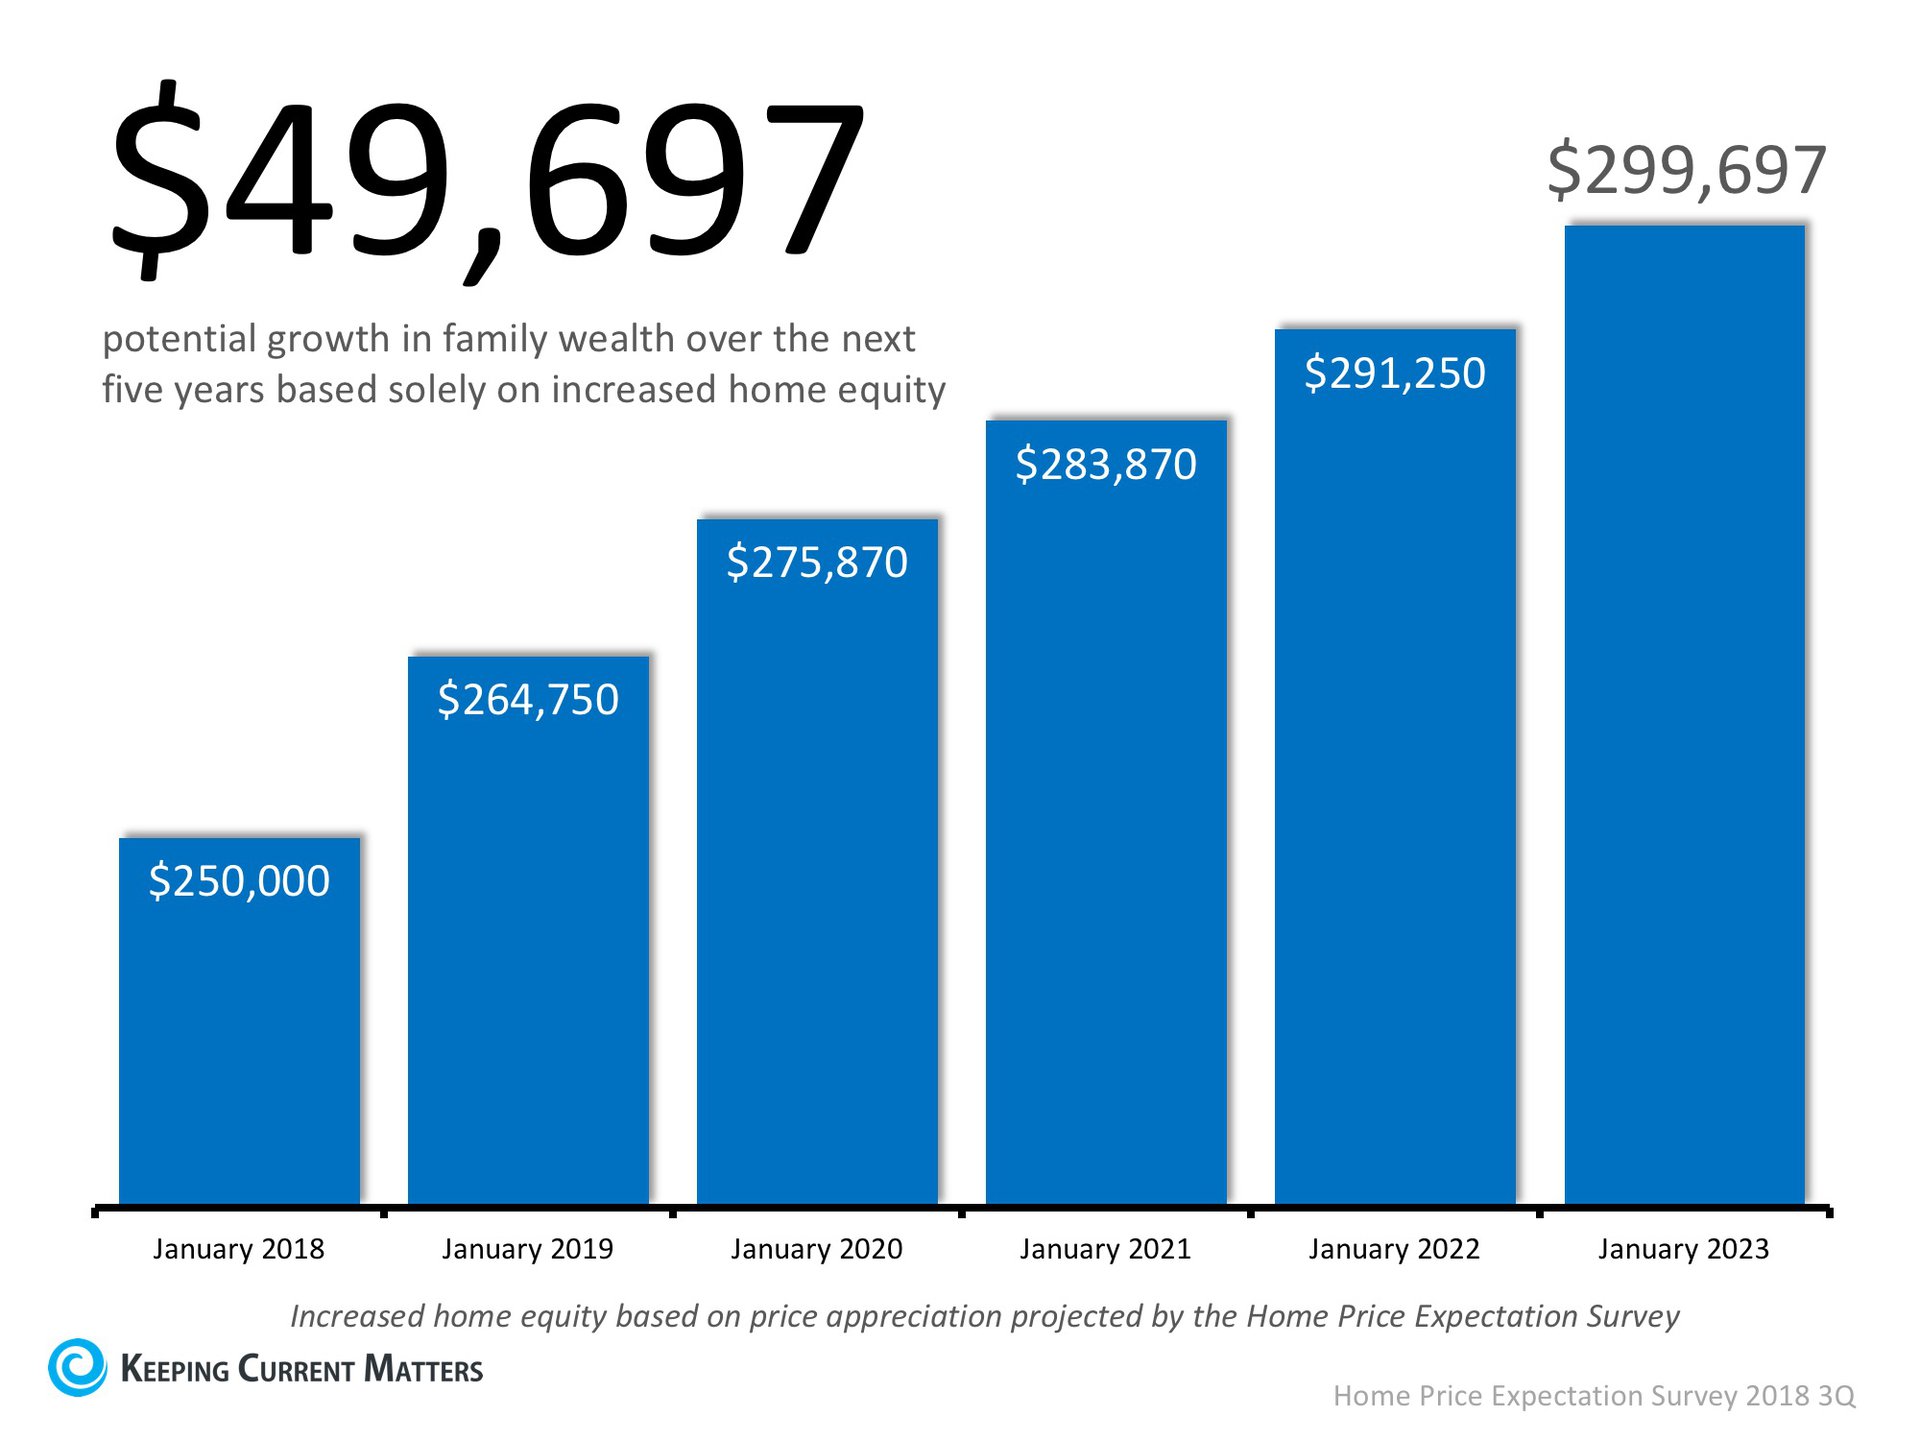
3. Less than a month ago, we explained that a family that purchased an average-priced home at the beginning of 2018 could build more than $49,000 in family wealth over the next five years.
4. Some argue that renting eliminates the cost of taxes and home repairs, but every potential renter must realize that all the expenses the landlord incurs are already baked into the rent payment – along with a profit margin!

Bottom Line

Owning your home has many social and financial benefits that cannot be achieved by renting.
Source: Keeping Current Matters | The KCM Crew 102618

Thursday, October 25, 2018

Are We About To Enter A Buyers’ Market?

Are We About to Enter a Buyers’ Market?
Home sales are below last year’s levels, home values are appreciating at a slower pace, and there are reports showing purchasing demand softening. This has some thinking we may be entering a buyers’ market after sellers have had the upper hand for the past several years. Is this really happening?
The market has definitely softened. However, according to two chief economists in the industry, we are a long way from a market that totally favors the purchaser:

Dr. Svenja Gudell, Zillow Chief Economist:

“These seller challenges don’t indicate we’re suddenly in a buyers’ market – we don’t expect market conditions to shift decidedly in favor of buyers until 2020 or later. But buyers certainly are starting to balk at the rapid rise in prices and home values are starting to grow at a less frenetic pace.”

Danielle Hale, Chief Economist of realtor.com:

“The signs are pointing to a market that’s shifting toward buyers. But, in most places, we’re still a long way from a full reversal.”
In addition, Pulsenomics Inc. recently surveyed over one hundred economists, real estate experts, and investment & market strategists and asked this question:
“When do you expect U.S. housing market conditions to shift decidedly in favor of homebuyers?”
Only 5% said the market has already shifted. Here are the rest of the survey results:
Are We About to Enter a Buyers’ Market? | Keeping Current Matters

Bottom Line

The market is beginning to normalize but that doesn’t mean we will quickly shift to a market favoring the buyer. We believe Ivy Zelman, author of the well-respected ‘Z’ Report, best explained the current confusion:
“With the rate of home price appreciation starting to decelerate alongside the uptick in inventory…we expect significant debate about whether this is a bullish or bearish sign.
In our view, the short-term narrative will probably be confusing, but more sustainable growth and affordability will likely be the end result.”
Source: Keeping Current Matters | The KCM Crew | 10252018 

Tuesday, October 23, 2018

2 Factors To Watch In Today’s Real Estate Market Whether Buying Or Selling


2 Factors to Watch in Today’s Real Estate Market Whether Buying or Selling
When it comes to buying or selling a home there are many factors you should consider. Where you want to live, why you want to buy or sell, and who will help you along your journey are just some of those factors. When it comes to today’s real estate market, though, the top two factors to consider are what’s happening with interest rates & inventory.

Interest Rates

Mortgage interest rates have been on the rise and are now over three-quarters of a percentage point higher than they were at the beginning of the year. According to Freddie Mac’s latest Primary Mortgage Market Survey, rates climbed to 4.72% for a 30-year fixed rate mortgage last week.
The interest rate you secure when buying a home not only greatly impacts your monthly housing costs, but also impacts your purchasing power.
Purchasing power, simply put, is the amount of home you can afford to buy for the budget you have available to spend. As rates increase, the price of the house you can afford to buy will decrease if you plan to stay within a certain monthly housing budget.
The chart below shows the impact that rising interest rates would have if you planned to purchase a $400,000 home while keeping your principal and interest payments between $2,020-$2,050 a month.
2 Factors to Watch in Today’s Real Estate Market Whether Buying or Selling | Keeping Current Matters
With each quarter of a percent increase in interest rate, the value of the home you can afford decreases by 2.5% (in this example, $10,000). Experts predict that mortgage rates will be over 5% by this time next year.

Inventory

A ‘normal’ real estate market requires there to be a 6-month supply of homes for sale in order for prices to increase only with inflation. According to the National Association of Realtors (NAR), listing inventory is currently at a 4.3-month supply (still well below the 6-months needed), which has put upward pressure on home prices. Home prices have increased year-over-year for the last 78 straight months.
The inventory of homes for sale in the real estate market had been on a steady decline and experienced year-over-year drops for 36 straight months (from July 2015 to May 2018), but we are starting to see a shift in inventory over the last three months.
The chart below shows the change in housing supply over the last 12 months compared to the previous 12 months. As you can see, in June, July, and August, inventory levels have started to increase as compared to the same time last year.
2 Factors to Watch in Today’s Real Estate Market Whether Buying or Selling | Keeping Current Matters
This is a trend to watch as we move further into the fall and winter months. If we continue to see an increase in homes for sale, we could start moving further away from a seller’s market and closer to a normal market.

Bottom Line

If you are planning to enter the housing market, either as a buyer or a seller, make sure that you have an experienced local agent who can help you navigate the changes in mortgage interest rates and inventory.

Source: Keeping Current Matter | The KCM Crew 102318

Monday, October 22, 2018

How Does The Supply Of Homes For Sale Impact Buyer Demand?


How Does the Supply of Homes for Sale Impact Buyer Demand?
The price of any item is determined by the supply of that item, as well as the market’s demand for it. The National Association of REALTORS (NAR) surveys “over 50,000 real estate practitioners about their expectations for home sales, prices and market conditions” for their monthly REALTORS Confidence Index.
Their latest edition sheds some light on the relationship between seller traffic (supply) and buyer traffic(demand).

Buyer Demand

The map below was created after asking the question: “How would you rate buyer traffic in your area?”
How Does the Supply of Homes for Sale Impact Buyer Demand? | Keeping Current Matters
The darker the blue, the stronger the demand for homes is in that area. The survey showed that in 38 out of 50 states buyer demand was slightly lower than this time last year but remains strong. Only six states had a ‘stable’ demand level.

Seller Supply 

The index also asked: “How would you rate seller traffic in your area?”
As you can see from the map below, 23 states reported ‘weak’ seller traffic, 22 states and Washington D.C. reported ‘stable’ seller traffic, and 5 states reported ‘strong’ seller traffic. This means there are far fewer homes on the market than what is needed to satisfy the buyers who are out looking for homes.
How Does the Supply of Homes for Sale Impact Buyer Demand? | Keeping Current Matters

Bottom Line

Looking at the maps above, it is not hard to see why prices are appreciating in many areas of the country. Until the supply of homes for sale starts to meet buyer demand, prices will continue to increase. If you are debating listing your home for sale, meet with a local real estate professional in your area who can help you capitalize on the demand in the market now!

Source: Keeping Current Matters | The KCM Crew 102218

Monday, October 15, 2018

Are Home Prices Softening Or Are They Falling?

Are Home Prices Softening or Are They Falling?

We are beginning to see reports that more housing inventory is coming to the market and that buyer demand may not be increasing at the same pace it did earlier this year. The result will be many headlines written to address the impact that these two situations will have on home values. Many of these headline writers will confuse “softening home prices” with “falling home prices,” but there is a major difference between the two. The data will begin to show that home values are not appreciating at the same levels as they had over the last several years (softening prices). This does NOT mean that prices are depreciating (falling prices). Here is an example: Over the last several years, national home values increased by more than 6% annually. If you had a home worth $300,000 at the beginning of the year, it would be worth $318,000 by year’s end. If the appreciation rate “falls” to 4%, that $300,000 house would be worth $312,000 at the end of next year – a $6,000 difference. The price of the home did not fall. It just didn’t increase at the level it had the previous year. Appreciation rates are projected to end this year at approximately 5%, and then drop to somewhere between 4-5% next year. This drop in appreciation rate will cause home price increases to soften.

Again, this does not mean that home prices will depreciate, but instead that they will appreciate more slowly.

Bottom Line

Be careful when reading headlines that discuss home values. Some headline writers will be legitimately confused and will use the word falling in place of softening. Others will realize that the headline “Home Prices are Falling!” will get more clicks than “Home Prices are Softening” and will intentionally write the more compelling headline. Read the article. If the word depreciation is not mentioned, home values are not falling.

Source: Keeping Current Matters | The KCM Crew 092718

Friday, October 12, 2018

The Cost Of NOT Paying PMI


The Cost of NOT Paying PMI
Saving for a down payment is often the biggest hurdle for a first-time homebuyer as median incomes, rents, and home prices all vary depending on where you live.
There is a common misconception among homebuyers that a 20% down payment is required, and it is this limiting belief that often adds months, and sometimes even years, to the home-buying process.

So, if you can purchase a home with less than a 20% down payment… why aren’t more people doing just that?

One Possible Answer:Private Mortgage Insurance (PMI)
Freddie Macdefines PMI as:
“An insurance policy that protects the lender if you are unable to pay your mortgage. It’s a monthly fee, rolled into your mortgage payment, that is required for all conforming, conventional loans that have down payments less than 20%.
Once you’ve built equity of 20% in your home, you can cancel your PMI and remove that expense from your mortgage payment.”
As the borrower, you pay the monthly premiums for the insurance policy, and the lender is the beneficiary. The monthly cost of your PMI depends on the home’s value, the amount of your down payment, and your credit score.
Below is a table showing the difference in monthly mortgage payment for a $250,000 home with a 3% down payment and PMI vs. a 20% down payment without PMI:
The Cost of NOT Paying PMI | Keeping Current Matters
The first thing you see when looking at the table above is no doubt the added $320 a month that you would be spending on your monthly mortgage cost. The second thing that should stand out is that a 20% down payment is $50,000!
If you are buying your first home, $50,000 is a large sum of money that takes discipline and sacrifice to save. Many first-time buyers save for 5-10 years before buying their homes.
To save $50,000 in 10 years, you would need to save about $420 a month. On the other hand, if you save that same $420 a month, you could afford a 3% down payment in less than a year and a half.
In a recent article by My Mortgage Insider, they explain what could happen in the market while you are waiting to save for a higher down payment:
“The time it takes to save a (larger) down payment could mean higher home prices and tougher qualifying down the road. For many buyers, it could prove much cheaper and quicker to opt for the 3% down mortgage immediately.”
The article went on to say,
“Since renters typically devote a higher percentage of their income to housing than homeowners, providing flexible down payment options can help renters with solid earnings purchase a home – and gain a fixed-rate mortgage with principal and interest payments that will not increase over the life of the loan.”
If the prospect of having to pay PMI is holding you back from buying a home today, Freddie Mac has this advice,
“It’s no doubt an added cost, but it’s enabling you to buy now and begin building equity versus waiting 5 to 10 years to build enough savings for a 20% down payment.”
Based on results of the most recent Home Price Expectation Survey, a homeowner who purchased a $250,000 home in January would gain $50,000 in equity over the next five years based on home price appreciation alone (shown below).
The Cost of NOT Paying PMI | Keeping Current Matters

Bottom Line

If you have questions about whether you should buy now or wait until you’ve saved a larger down payment, meet with a professional in your area who can explain your market’s conditions and help you make the best decision for you and your family.

Source: Keeping Current Matters | The KCM Crew 092618

Tuesday, October 2, 2018

Are Homebuyers Starting To Hit The ‘Pause’ Button?

Are Homebuyers Starting to Hit the ‘Pause’ Button?
For the last several years, buyer demand has far exceeded the housing supply available for sale. This low supply and high demand have led to home prices appreciating by an average of 6.2% annually since 2012. With this being said, three of the four major reports used to measure buyer activity have revealed that purchasing demand may be softening. Here are the four indices, how they measure demand (methodology), what their latest reports said, and a quick synopsis of the report.

The Foot Traffic Report by the National Association of Realtors

Methodology: Every month SentriLock, LLC provides NAR Research with data on the number of properties shown by a REALTOR®. Lockboxes made by SentriLock, LLC are used in roughly a third of home showings across the nation. Foot traffic has a strong correlation with future contracts and home sales, so it can be viewed as a peek ahead at sales trends two to three months into the future. Latest Report“Foot Traffic climbed 3.2 points to 55.8 mid-summer in July. Additionally, the diffusion index is higher than last year by 13.5 points. Despite a healthy economy and labor market, supply and new construction remains unable to keep up with buyer demand.” Synopsis: Buyer demand remains strong.

The Showing Index by ShowingTime

Methodology: The ShowingTime Showing Index® tracks the average number of buyer showings on active residential properties on a monthly basis, a highly reliable leading indicator of current and future demand trends. Latest Report“Showing activity throughout the country increased by 0.3 percent year over year in July, the third consecutive month that the U.S. ShowingTime Showing Index recorded buyer interest deceleration compared to the previous year. The June 2018 figures revealed a 0.0 percent change in showing traffic from 2017, while May showed a 1.2 percent year-over-year increase. The 12-month average year-over-year increase was 4.6 percent.” Synopsis: Buyer demand is softening

Realtors Confidence Index by the National Association of Realtors

Methodology: The REALTORS Confidence Index is a key indicator of housing market strength based on a monthly survey sent to over 50,000 real estate practitioners. Practitioners are asked about their expectations for home sales, prices and market conditions. Latest Report“REALTORS reported slower homebuying activity in July 2018…The REALTORS® Buyer Traffic Index registered at 62, down from the same month one year ago (69). This is the fifth straight month (since March 2018) that Realtors reported a decline in buyer activity compared to conditions one year ago.” Synopsis: Buyer demand is softening

The Real Estate Broker Survey in the ‘Z’ Report by Zelman and Associates (subscription needed)

Methodology: Proprietary survey results of real estate executives. Latest Report“While we continue to expect a resumption of growth in resale transactions on the back of easing inventory in 2019 and 2020, our real-time view into the market through our Real Estate Broker Survey does suggest that buyers have grown more discerning of late and a level of “pause” has taken hold in many large housing markets. Indicative of this, our broker contacts rated buyer demand at 69 on a 0-100 scale, still above average but down from 74 last year and representing the largest year-over-year decline in the two-year history of our survey.” Synopsis: Buyer demand is softening

Bottom Line

Again, three of the four most reliable measures of buyer activity are reporting that demand is softening. We had a strong buyers’ market directly after the housing crash which was immediately followed by a strong sellers’ market over the last six years. If demand continues to soften and supply begins to grow (as is projected to happen), we will return to a more neutral market which will favor neither buyers nor sellers. This “more normal” market will be better for real estate in the long term.

Source: Keeping Current Matters | The KCM Crew 100218